interactive
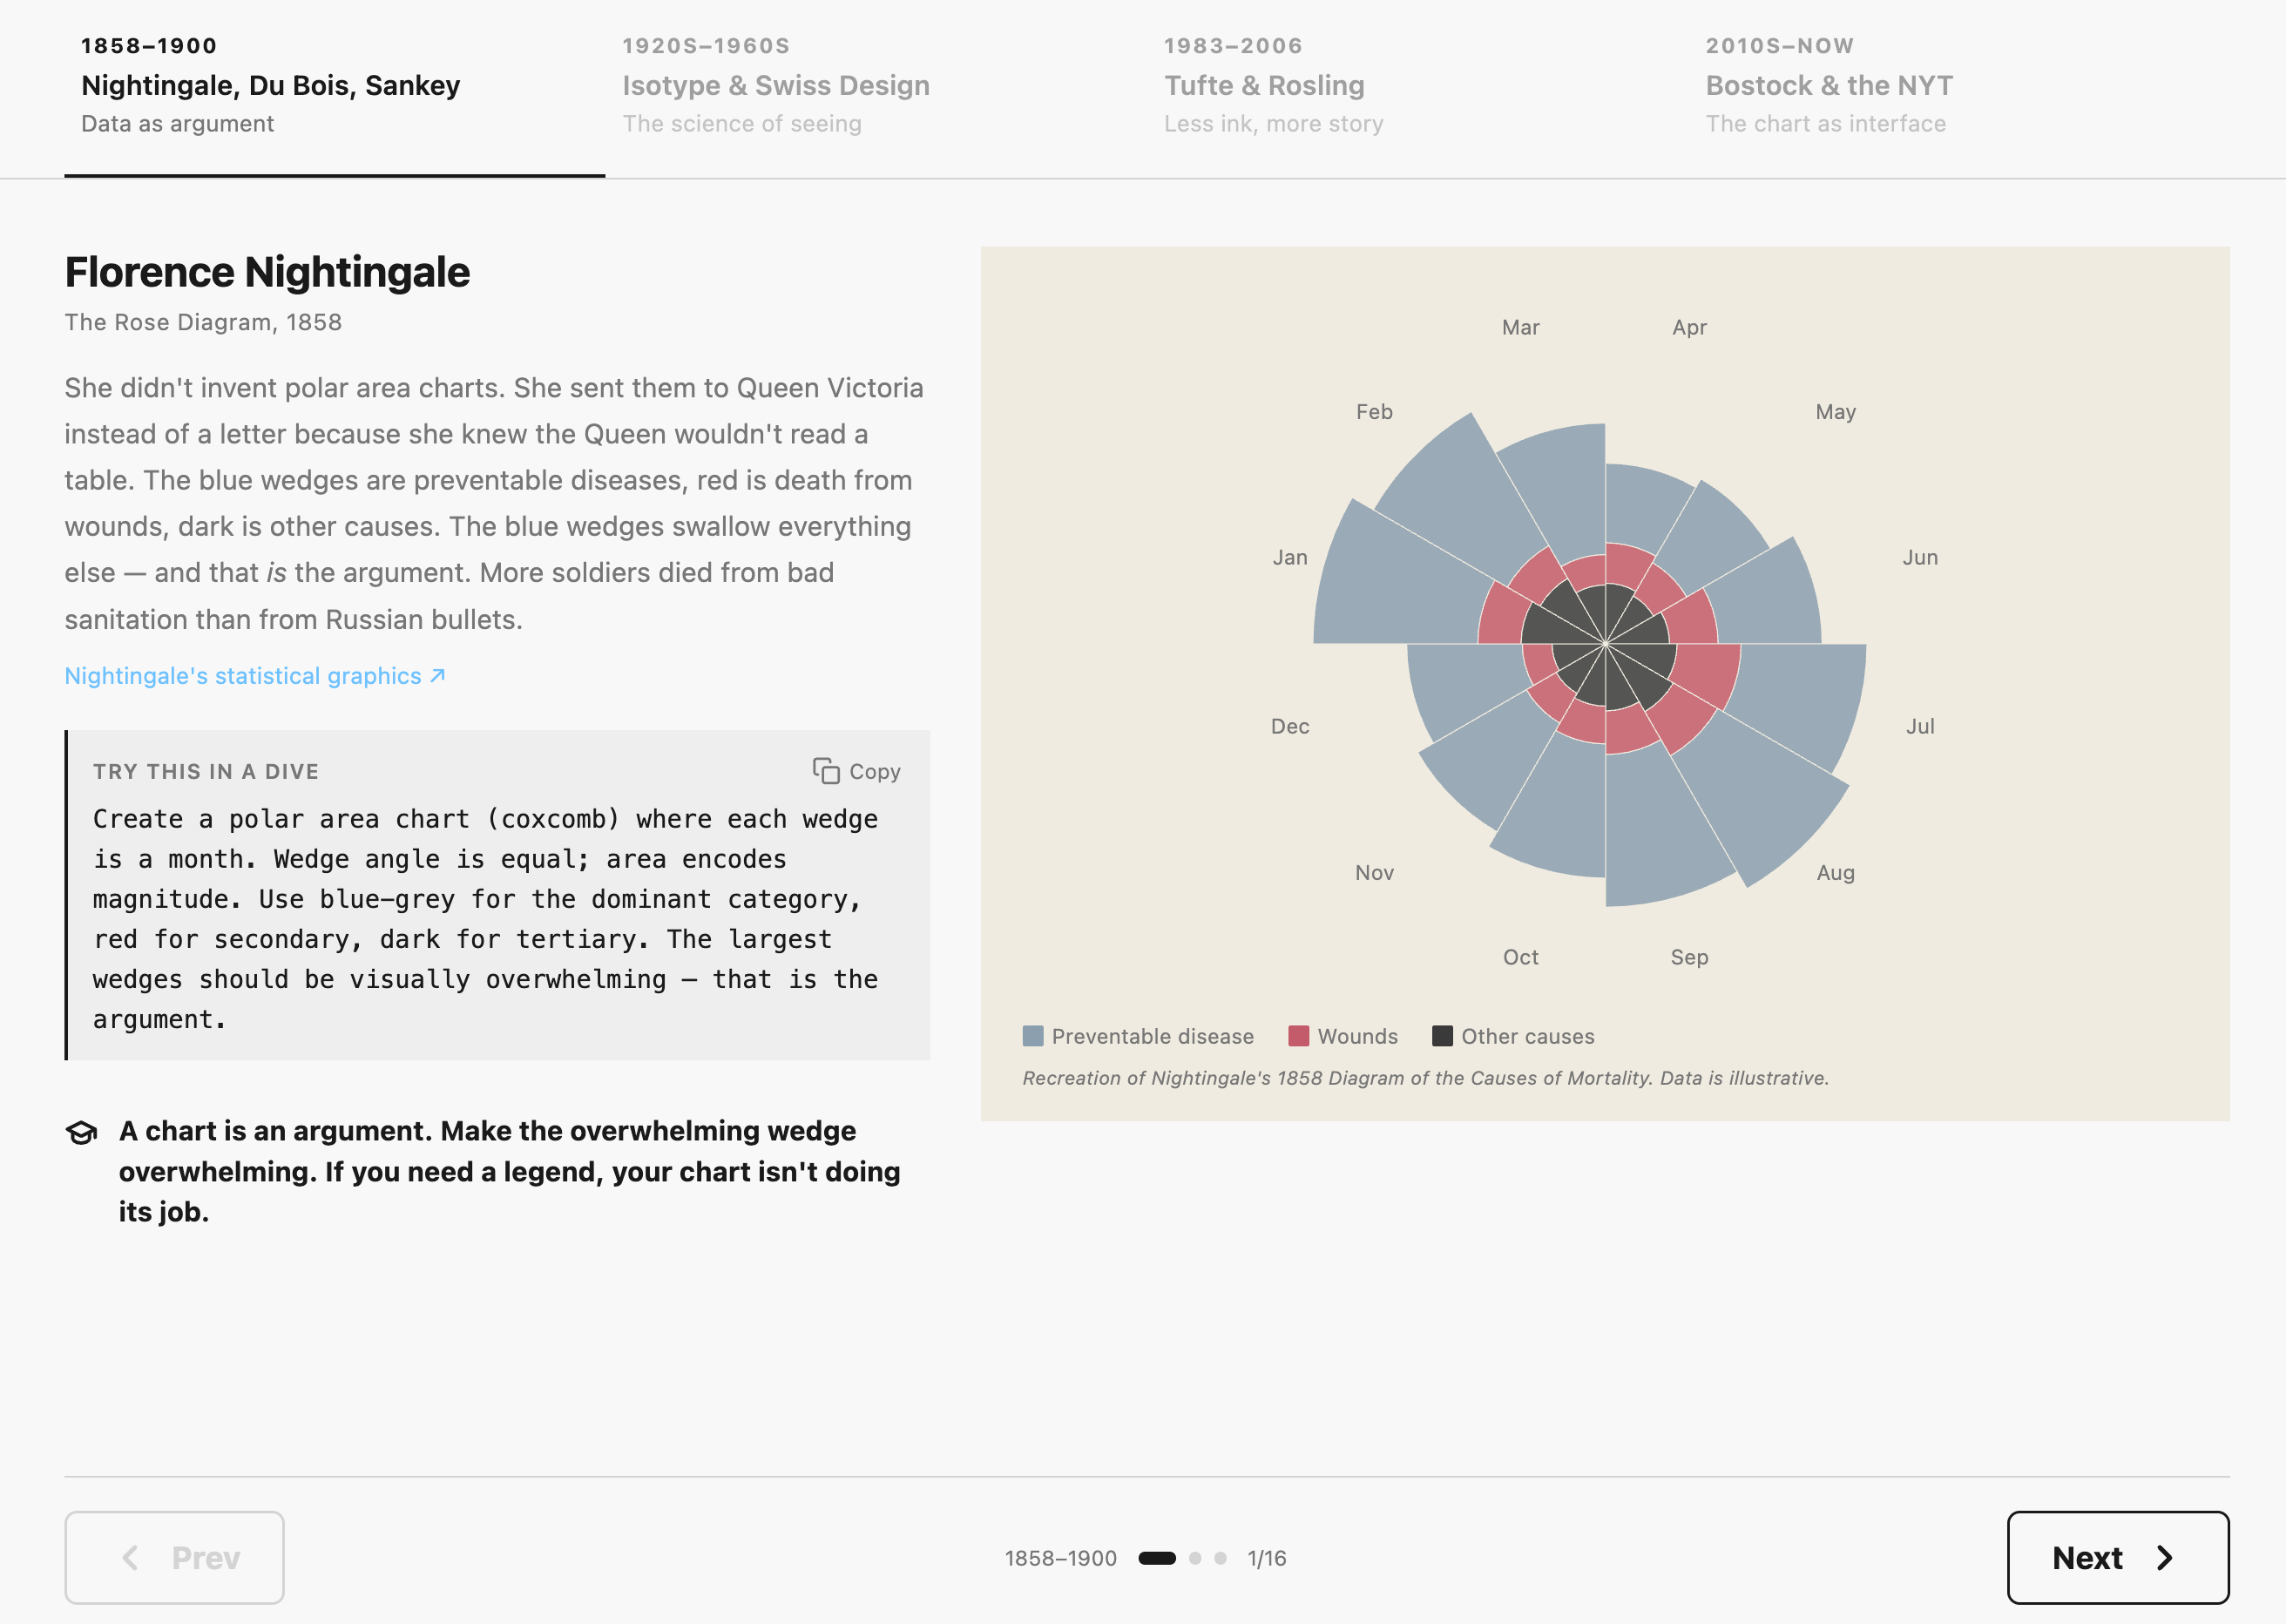
A Brief History of Data Visualization
16 interactive slides on the history of data visualization, from Nightingale’s rose diagrams and Du Bois’s data portraits to Tufte’s data-ink ratio and D3.js. Each slide includes a hands-on prompt to recreate the chart in a MotherDuck Dive.